-
The Global Map of Environmental & Social Risk in Agro-commodity Production (GMAP) enables users to conduct rapid environmental and social due diligence associated with trade and short-term finance, and to make responsible and strategic sourcing, financing, and risk management decisions.
Use the tool to access detailed risk analysis reports and explore risk management guidance. -
Register for a free account to get access to GMAP, including detailed risk analyses, risk management guidance, and more! FREE JOIN US
The Risk Analysis
OVER 250 COUNTRY-COMMODITY REPORTS
GMAP generates country-commodity Risk analysis Reports using a unique methodology aligned to IFC’s Performance Standards on Environmental and Social Sustainability, and by assigning a color-coded risk score to country-commodity combinations, facilitating a rapid financing and source assessment.
- Low Risk
- 0

- 76

- 80

- 100
- High Risk

The Tools
VIEW, ANALYZE, COMPARE, DISCOVER
View reports by country or commodity to get in-depth coverage of production aligned to IFC’s Performance Standards on Environmental and Social Sustainability (PS2, PS6). Combine indicator scores from the reports to create comparative charts across countries or commodities. Discover alignment with certification schemes that cover your countries and commodities.
The Map View
VISUALIZE AND SEARCH
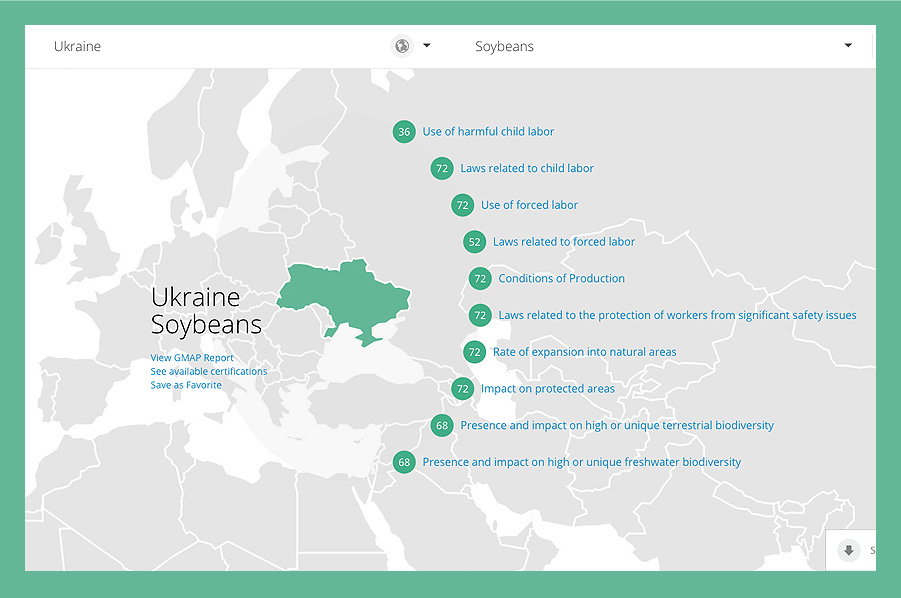
The Map View let’s you visualize and search commodities across the globe. Click on a country to see which commodities are featured and quickly identify their overall and indicator-specific risk scores.
From there you can access individual reports.
Go to map view

The List View
SEARCH AND GAIN QUICK ACCESS TO FULL REPORTS
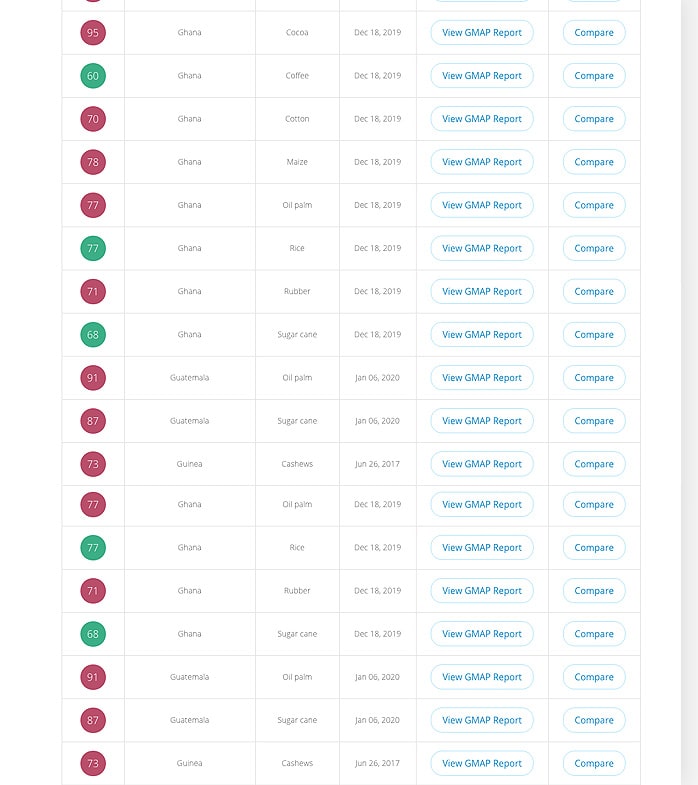
The List View let’s you search all of the countries and commodities in GMAP database. From here you can view the overall risk score for any country-commodity combination, gain access to the full report, determine the date of publication, and select commodities to compare.
Go to list view
Score Comparision
CHART SCORES ACROSS COUNTRIES AND COMMODITIES
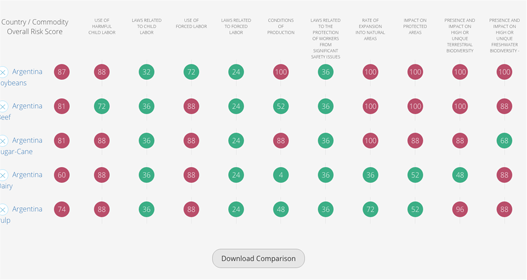
The Score Comparison view let’s you visualize Country-Commodity risk scores across all Performance Standard indicators from multiple reports.
Use the Score Comparison chart to assess risks across commodities in a single country or select reports unique to your supply chain.
Go to comparision chart
Certification Schemes
COMPARE CERTIFICATIONS RELEVANT TO SPECIFIC COUNTRIES AND COMMODITIES
The Certification Schemes automatically map known certifications from the ICC that cover any Country-Commodity combination in question.
Use this chart to explore certifications relevant to your unique supply chain.
Go to certification schemes

IDA/FCS Highlight Countries
DEVELOPMENT CHALLENGES
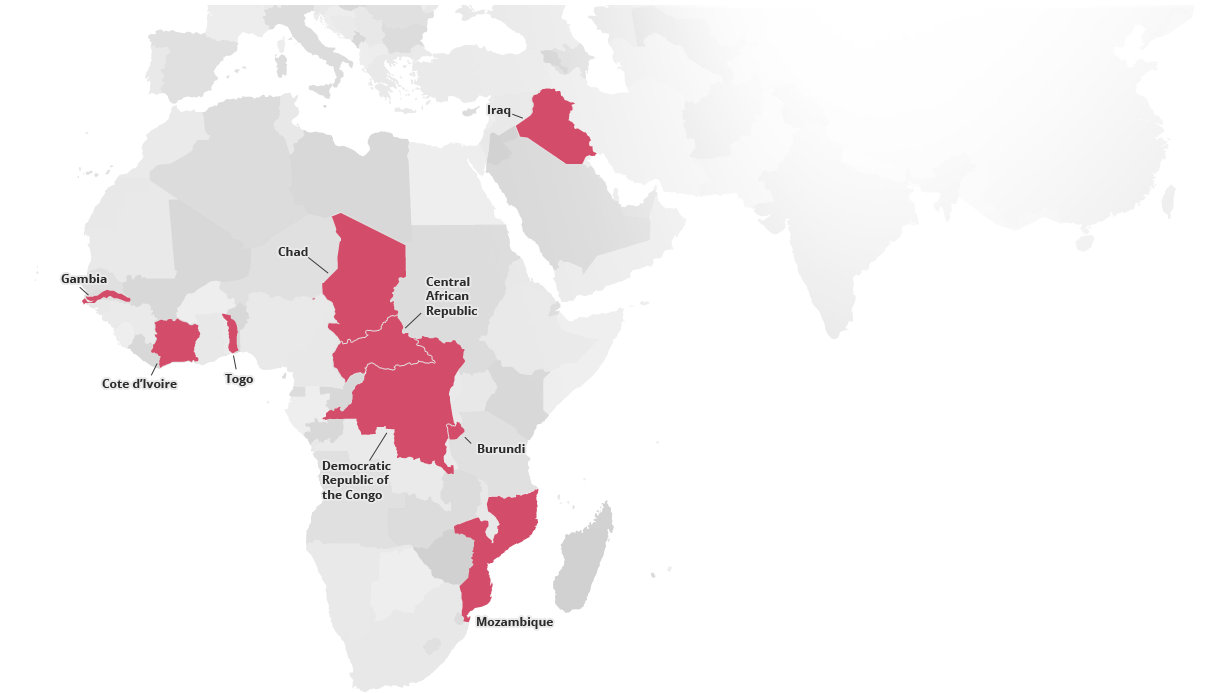
More than 1 billion people live in countries mired in a cycle of ongoing fragility, conflict, and poverty. Increasing investment and impact in low-income International Development Association (IDA) countries and Fragile and Conflict Situations (FCS) is central to IFC’s 3.0 strategy and mission. These economies face acute development challenges and need investments that will create jobs, spur economic growth, and create hope for people.
To scale up its investment in these difficult markets, IFC has adopted a strategic approach—homing in on sectors, geographies, and interventions that hold the greatest potential for unlocking private sector growth. After more than doubling investments in fragile situations during the last decade, IFC has pledged that, by 2030, 40 percent of its annual commitments will be in IDA and FCS countries.
See the reports
New Account Creation Required
As part of our platform upgrade, we kindly request all visitors to create a new account. Click here to Register.
If you have any questions, please feel free to reach out to us directly at asksustainability@ifc.org